Whenever you come across an issue (which we hope is rare!), sometimes our developers need more information, in order to fix it. They need to know what is going on in the backend (where all that code and stuff that looks like gibberish lives). This is where Inspect element comes in.
Note: This process is for Chrome and Firefox users, see this article for Safari.Divvy Details
Inspect allows you to see what is going on in the backend, whenever you perform an action in Divvy. What we need you to do, is recreate the issue you found while Inspect is open, and take a screenshot of the error as it happens and include the code.
How to Inspect Elements
Step 1
Find the spot where you are experiencing an issue and right-click anywhere close to it and select Inspect. You will then see a slide in either from the side or the bottom of your browser.
- For Safari browser - from the menu bar at the top, go to Develop > Show Web Inspector
- If Develop is not in the top menu bar, go to Safari > Preferences > Advanced, and check- mark the Show Develop menu in menu bar
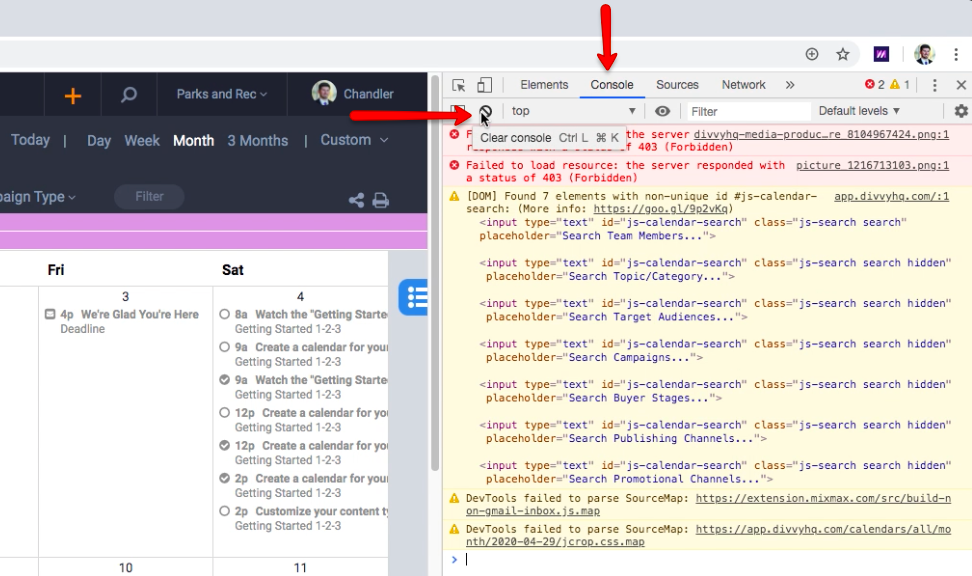
Go to the Console tab (Illustrated below) and click the Clear Console button. This will clear everything that is in the window and give us a fresh view of the code that follows when you try to recreate the issue.

Recreate the issue. Once you do, you should see code populating in the Inspect window. Sometimes the information may be highlighted yellow or red. Take a screenshot of the issue, along with the code that is in the Inspect window, and save it for later.

Step 3
Repeat steps 1 and 2 but this time, start at the Network tab instead when you open up the Inspect window.

